
The Effect of Population Aging
On Future Hospital Demand
A simulation of future spending finds that aging will not be the strongest influence on inpatient hospital use.
ABSTRACT:
This analysis examines how shifts in the age distribution of the U.S. population, reflecting both the aging of the baby-boom generation and increased longevity, will affect demand for hospital inpatient services during the next ten years. Over that period, aging will drive about 0.74 percent annual growth in use of services. Aging’s effect on inpatient demand varies by medical condition, with the highest rates of growth in services most used by elderly patients. Even for those services, however, aging is a much less important factor than local population trends and changing practice patterns attributable to advancing medical technology.
A common theme permeating a wide range of contemporary health policy debates is the gradual aging of the U.S. population and its effect on the U.S. health care system. As a result of the baby-boom generation—the leading edge of which is now turning age sixty—the proportion of the U.S. population older than age sixty-five is projected to grow from 12.4 percent in 2005 to 14.5 percent in 2015 and 18.2 percent in 2025.1 Although the aging of the baby-boom generation is a key factor in the aging of the population as a whole, increasing life expectancy is also important.
Numerous discussions regarding the U.S. hospital industry dwell on the need to expand capacity to accommodate a growing elderly population. With a sharp increase in hospital construction taking place and expansions often controversial, the aging of the baby boomers is often raised as a justification that cannot be disputed. But although few would dispute that aging will increase the demand for hospital services, previous research has suggested that in fact the magnitude might be small in relation to the overall trend.2
This study seeks to build on previous research on the effect of population aging on hospital use by examining how aging will specifically affect demand for inpatient services and how this impact will vary across medical conditions.
Study Data And Methods
This study predicts how changes in the age distribution of the U.S. population will affect the future use of hospital inpatient services, all else held constant. It seeks to isolate the effect of population aging (taking into account accepted assumptions about future fertility, mortality, and immigration) from other factors that could affect hospital demand. We devote most of our attention to a ten-year horizon, which is most relevant for hospital capacity planning. This exercise requires two distinct types of data: age-specific hospital inpatient utilization rates for a particular year, and age-specific projections of the U.S. population for each year during the projection period.
The study focuses specifically on inpatient hospital use. Although a study applicable to hospital outpatient settings would also be valuable, such a study would be limited by data availability and by the uncertainty of the outcome of the growing competitive battle between hospitals and physician-owned facilities, such as outpatient surgical centers, imaging centers, and physician offices, which provide increasingly more of the ambulatory tests and procedures received by U.S. patients.
The most recent surveys of outpatient hospitalization derive from the National Center for Health Statistics (NCHS) National Hospital Ambulatory Medical Care Survey (NHAMCS) and National Survey of Ambulatory Surgery (NSAS).3 Together, these surveys cover the spectrum of hospital services in ambulatory settings. However, the most precise measure of outpatient use is a count of outpatient visits. Because a count of visits does not distinguish between services requiring few resources, such as a visit for primary care, and those requiring extensive resources, such as complex imaging, it is not very useful for this analysis. Since the use of inpatient services varies more by age than use of hospital outpatient services does, limiting the study to inpatient services will result in a higher estimate of the impact of aging than one that covered all of hospital care.4
Inpatient use. We used two measures of total inpatient utilization, both derived from the 2003 Nationwide Inpatient Sample (NIS). Conducted by the Agency for Healthcare Research and Quality (AHRQ) as part of its Healthcare Cost and Utilization Project (HCUP), the NIS is a stratified probability sample of all nonfederal, short-stay, general, and specialty community hospitals in those states that contribute data to the HCUP. The thirty-seven states that contributed 2003 data to the project created a sample of 994 hospitals with 7,977,728 inpatient stays. The NIS is weighted to be representative of all U.S. inpatient stays.5
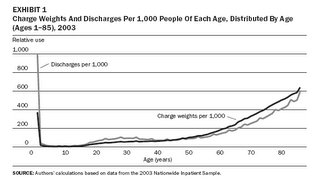
Since older hospitalized patients are likely to have higher resource needs (Exhibit 1), we used a more refined proxy for inpatient utilization than discharges: the all-payer severity-adjusted diagnosis-related group (APS-DRG) relative charge weights. DRGs form a system of classification that organizes inpatient hospitalizations into categories similar in diagnosis and treatment; APS-DRGs further divide DRGs into groups based on severity. Each APS-DRG corresponds to a specific charge weight that reflects its relative dollar amount of expenditures, controlling for variations in hospital-specific factors such as wages.
 APS-DRG relative charge weights were created by HSS Inc. using per person charge data from the 2001 NIS. Relative charge weights ranged from 0.096 to 26.212, with a mean charge of $14,738.60. A total expected expenditure on a given APS-DRG in 2003 is obtained by multiplying the relative charge weight associated with that APS-DRG by this mean charge value and 2003 NIS data on the number of charges for each APS-DRG. Cumulatively, these APS-DRG charge weights indicate detailed expenditures on the use of virtually all hospital inpatient services in 2003.6
The NIS sample is large enough to permit estimates of utilization by age and DRG, thereby allowing an examination of the varying effects of aging on inpatient hospital demand by medical condition. Using the 2003 NIS, we calculated age-specific utilization rates and simulated the impact of changes in the age distribution of the population for the full set of major diagnosis categories (MDCs)—groupings of DRGs—and for the ten most highly used DRGs specifically.7
Population estimates. The population estimates were developed by the U.S. Bureau of the Census Population Projection Program using the census 2000 modified race data. Time-series analysis of historical trends are used to extrapolate fertility, mortality, and immigration rates fifty years into the future.8 The impact of medical advances on the age distribution is captured by extrapolation of earlier trends in mortality.
Calculations. First, we calculated the per person utilization rate for people of each age up to eighty-five (all people age eighty-five and older are grouped together) using the 2003 NIS APS-DRG relative charge weights and total number of discharges and U.S. Census Bureau population projections for 2003. Second, for each age, we multiplied our calculated utilization rate estimate by the total number of people of that age in a given year as reflected in the Census Bureau population projections, giving a projection of total use for people of each age in that year. Third, we summed the projections of total use by age and divided by the total projected population, giving a simulated estimate of utilization per person for the entire population in that year. We repeated this procedure for each year in our study period, holding the utilization rates per person constant throughout, and we calculated the change from one year to the next. This change represents the effect of shifts in the age distribution of the population, holding all other drivers of hospital demand constant.9
We then compared this estimate to the Centers for Medicare and Medicaid Services’ (CMS’s) projected change in total inpatient hospital spending for the period 2005–2015. Although the CMS has not released projected data for inpatient revenue alone, we calculated past trend differences between inpatient and total hospital spending and assumed a continued differential.
Study Findings
Aging’s effect on total inpatient hospital utilization. The effect of aging on hospital utilization—or any other measure of utilization or spending, for that matter—will be driven by two factors: the rate at which the age distribution of the population is shifting toward older ages, and the rate at which utilization increases with age. Despite popular conceptions, the age distribution of the population shifts very slowly from one year to the next; between 2005 and 2015, the average age of the U.S. population is projected to increase from 36.5 to 37.9—an average annual increase of 0.37 percent. This slow growth in the age distribution of the population limits the magnitude of the impact on utilization.
Based on the methodology discussed above, our simulations indicate that from 2005 to 2015, per person inpatient resource use will increase by 7.6 percent because of aging, or 0.74 percent per year (Exhibit 2). When combined with projected population growth of 0.9 percent per year, total demographic trends will increase resource use by 1.6 percent per year. When a cruder measure of utilization is used—total discharges—the annual increase is 0.51 percent per year. Using APS-DRG weights has a meaningful impact on the results, increasing the estimate of aging by 45 percent.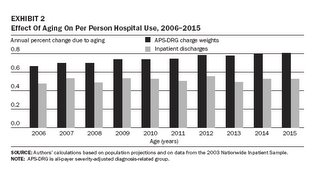 However, aging still accounts for a relatively small portion of the growth in hospital spending projected for the next decade: only 11.8 percent of the total increase in inpatient spending from 2005 to 2015.10
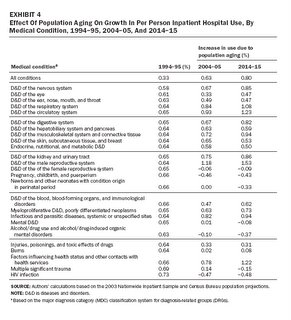
Many perceive that the impact of aging during the next ten years will be higher than it was for the previous ten years; this perception is correct. We estimate that aging increased inpatient utilization by 0.35 percent per year from 1995 to 2005. One can also assess the changing impact of aging by comparing annual increases in inpatient utilization for selected one-year periods. For 1994–95, 2004–05, and 2014–15, the aging factors are 0.33 percent, 0.63 percent, and 0.80 percent, respectively.
This increasing rate of growth in inpatient utilization because of aging results from the shape of the distribution of inpatient utilization by age (Exhibit 1). The distribution of charge weights indicates a greater increase in utilization among the elderly than the distribution of discharges; however, both graph lines reveal that utilization begins to accelerate when people reach their mid-50s and continues to rise until death. Consequently, as the baby-boom generation ages and the proportion of the population older than the mid-50s swells, inpatient utilization rates will accelerate accordingly.
Using the same methodology employed above, we projected annual per person changes in utilization through 2050. Aging will continue to increase utilization at an increasing rate until 2020–2022, when the yearly increase will plateau at 0.89 percent. By that point, the lagging edge of the baby-boom population will have passed the age at which age-specific utilization accelerates, so the yearly increase in inpatient utilization will become steadily smaller, declining to an increase of only 0.07 percent in 2050.
Variation by medical condition. The effect of aging varies widely across the types of medical conditions treated in an inpatient setting. Population aging will have a relatively large effect on the use of services by patients classified in the MDC “diseases and disorders of the circulatory system” (Exhibit 3).
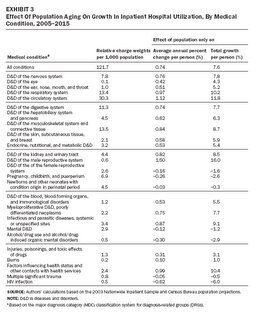 This MDC includes such highly used cardiovascular DRGs as 127 (heart failure and shock), 143 (chest pain), and 107 (coronary bypass with cardiac catheterization). Inpatient utilization for this group of DRGs will grow 11.8 percent per person, or 1.12 percent per person per year from 2005 to 2015, as a result of population aging alone. Aging will increase utilization for this MDC for 1994–95, 2004–05, and 2014–15 by 0.65 percent, 0.93 percent, and 1.23 percent, respectively (Exhibit 4).
 Population aging will also have a relatively large impact on a number of other categories of medical conditions, such as diseases and disorders of the male reproductive system (which includes the DRG for prostate cancer), diseases and disorders of the respiratory system (which includes the DRG for chronic obstructive pulmonary disease and pneumonia), and disorders of the musculoskeletal system and connective tissue (which includes a number of orthopedic-related DRGs, including hip replacement). Aging will drive 1.50 percent, 0.97 percent, and 0.84 percent per person annual growth in use for these MDCs, respectively.
Just as aging has a particularly large impact on selected sets of medical conditions, it also has the opposite effect on others. This is particularly true for DRGs related to maternity care and mental illnesses. In fact, population aging alone would actually lead to virtually no change or to a decline in annual per person use of three heavily used MDC groupings: pregnancy, childbirth, and the puerperium; newborns and other neonates with condition origin in the perinatal period; and mental diseases and disorders. From 2005 to 2015, if nothing other than the age distribution of the population changed, per person use of DRGs that fall under the two maternity care–related MDCs would change by –0.26 percent and –0.03 percent per year, respectively; during the same period, use of the DRGs for mental illness would decline by 0.12 percent per year.
Exhibit 5 presents the simulated effect of population aging on the ten most heavily used DRGs; it clearly demonstrates variation across medical conditions treated in the inpatient setting. For four of these ten DRGs—one cardiac-related condition, two respiratory-related conditions, and one orthopedic-related condition—aging’s impact on inpatient utilization will be greater than 1 percent per person per year during the next ten years. Meanwhile, population aging will have no effect on the use of four DRGs related to maternity care or mental illness.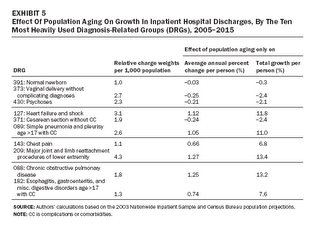 Discussion And Implications
A growing body of research in recent years has begun to quantify the effect of coming changes in the age distribution of the U.S. population that is largely attributable to the aging of the baby-boom generation. Although aging will likely have an important impact on spending, its magnitude will be dwarfed by the impact of advances in technology and other factors that affect medical practice patterns. To see this, consider coronary artery bypass graft (CABG) surgery and percutaneous transluminal coronary angioplasty (PTCA). Between 1993 and 2002, if nothing had changed other than the age distribution of the population, use of each of these procedures would have increased 0.6 percent per year. However, the actual rates of growth for these two procedures were strikingly divergent: The number of patients who received PTCA during an inpatient stay grew a total of 83.4 percent, or 7 percent per year, from 1993 to 2002, while the number of patients on which CABG was performed grew a total of 1.4 percent, or 0.2 percent per year.11
This study does not take into account potential interactions between changes in practice patterns and aging—in other words, will new technologies that increase use of services affect older people disproportionately? We do not see compelling evidence of any particular interaction. The empirical record of the past forty years does not exhibit a consistent pattern supporting the notion that the distribution of utilization by age is shifting toward older ages. Between 1963 and 1987, spending on hospital care per elderly American (8 percent per year) did in fact grow twice as fast as such spending on people under age sixty-five (3.8 percent per year). However, that pattern reversed itself between 1987 and 2000, when hospital spending among the population under age sixty-five outgrew such spending on elderly Americans by a three-to-one margin (3 percent versus 1 percent per year).12 Although having a large elderly population could influence priorities in industries that develop new medical technologies, this historical record suggests that advances in technology not responsive to health system developments will probably dwarf this incentive. Some have maintained that those in the baby-boom generation culturally are inclined to make greater demands on the medical care system than their parents and grandparents did, but we find it difficult to ever validate this, when baby boomers have dramatically expanded possibilities to draw from than did those a generation or two older.13
This analysis provides some guidance relevant to hospital industry planning for expansion of capacity. In general, the effect of aging effect on use of inpatient services will be small, but it will have a larger impact on use by patients with certain types of medical conditions that are more concentrated among the elderly. But for many of the conditions highlighted in this analysis, changing technology is a much larger factor in changes in treatment than population aging. In local geographic areas, forecasts of population growth will probably be more important for planning than forecasts of aging will be. Indeed, site-visit analyses in the Community Tracking Study (CTS) show sharp contrasts between areas like Phoenix, in which population growth is so high that risks of too much expansion of capacity are negligible, and areas like Syracuse, with stagnant or declining populations, which need to exercise much more care in forecasting demand.
Of course, hospitals must plan for capacity for ancillary services that will serve both inpatients and outpatients. But projecting demand for outpatient services is particularly difficult now because of recently developing trends of investment in outpatient facilities owned by physicians.14 These facilities’ competitive threat to hospitals could not have been foreseen a few years ago, which makes its importance five years into the future very difficult to predict.
The authors gratefully acknowledge the Robert Wood Johnson Foundation for its financial support.
NOTES
1. Calculated by authors from U.S. Census Bureau, “U.S. Interim Projections by Age, Sex, Race, and Hispanic Origin,” 26 August 2004, http://www.census.gov/ipc/www/usinterimproj (accessed 13 March 2006).
2. B.C. Strunk and P.B. Ginsburg, “Aging Plays Limited Role in Health Care Cost Trends,” Data Bulletin no. 23 (Washington: Center for Studying Health System Change, September 2002); U.E. Reinhardt, “Does the Aging of the Population Really Drive the Demand for Health Care?” Health Affairs 22, no. 6 (2003): 27–39; B. Alemayehu and K.E. Warner, “The Lifetime Distribution of Health Care Costs,” Health Services Research 39, no. 3 (2004): 627–642; and S.P. Keehan et al., “Age Estimates in the National Health Accounts,” Health Care Financing Review, 2 December 2004, http://www.cms.hhs.gov/apps/review/web_exclusives/keehan.pdf (accessed 14 March 2006).
3. For a complete description of the NHAMCS, see L.F. McCaif and T. McLemore, Plan and Operation of the National Hospital Ambulatory Medical Care Survey, Vital and Health Statistics Series 1, no. 34 (Hyattsville, Md.: National Center for Health Statistics, July 1994). For a complete description of the NHDS, see C. Dennison and R. Pokras, Design and Operation of the National Hospital Discharge Survey: 1988 Redesign, Vital and Health Statistics Series 1, no. 39 (Hyattsville, Md.: NCHS, December 2000).
4. We compared the age pattern of hospital visits for outpatient hospitalizations, emergency department (ED) services, and ambulatory surgery with that of inpatient discharges using the 1996 NHAMCS, 1996 NHDS, and 1996 NSAS. For a complete description of the NSAS, see T. McLemore and L. Lawrence, Plan and Operation of the National Survey of Ambulatory Surgery, Vital and Health Statistics Series 1, no. 37 (Hyattsville, Md.: NCHS, October 1997). All three surveys are conducted by the NCHS as components of its National Health Care Survey and therefore use the same hospital universe and a similar survey design. A simple comparison of outpatient and ED hospitalization, ambulatory surgery in a hospital setting, and inpatient hospitalization suggests that variation in use of outpatient and ED hospitalizations by age is much smaller than age variation in use of inpatient hospitalization. Outpatient and ED visits varied only by a factor of 2 between the lowest-using age group (children ages 6–12) and the highest-using age group (elderly adults over age eighty-five). In stark contrast, inpatient hospitalizations varied by more than a factor of 30 across age groups. The number of ambulatory surgery visits per person varied by a factor of 10 between the lowest-using group (children ages 6–12) and the highest-using group (adults ages 75–84).
5. For more information about the 2003 NIS, see Healthcare Cost and Utilization Project, “Overview of the National Inpatient Sample,” 6 January 2006, http://www.hcup-us.ahrq.gov/nisoverview.jsp (accessed 6 March 2006).
6. HSS Inc., All Payer Severity-Adjusted DRGs (APS-DRGs): Normalized Charge, LOS, and Mortality Weights Version 0402H (for APS-DRGs Version 21), 2004,
http://www.hcup-us.ahrq.gov/db/nation/nis/APS-DRGs%20V21%20Weights%20Manual.pdf (accessed 17 February 2006).
7. Our analysis at the MDC level excludes those DRGs that are assigned to multiple MDCs, with the exception of those that fall predominantly in one MDC. The DRGs excluded constitute only 0.75 percent of total discharges in 2003. Also, individual charge weight and discharge data for each age in Texas have been interpolated from data on five-year age intervals.
8. See U.S. Census Bureau, “U.S. Interim Projections”; see also U.S. Census Bureau, “Methodology and Assumptions for the Population Projections of the United States: 1999 to 2100,” Population Division Working Paper no. 38 (Washington: Census Bureau, January 2000), for detailed information about these assumptions.
9. This procedure replicates that of previous analyses; for example, see Strunk and Ginsburg, “Aging Plays Limited Role”; and Reinhardt, “Does the Aging of the Population?”
10. The Centers for Medicare and Medicaid Services provide projections for total hospital spending through 2014 based on data from the 2003 National Health Expenditure Accounts. We extended the projection to 2015 by assuming the same annual increase as projected for the 2010–2014 period. We used past trend differences between inpatient and total hospital spending to predict inpatient revenue from 2005 to 2015.
11. Authors’ calculations based on data from the NIS. Data obtained through AHRQ, HCUPNet, http://hcup.ahrq.gov/HCUPnet.asp (accessed 6 March 2006).
12. E. Meara, C. White, and D.M. Cutler, “Trends in Medical Spending by Age, 1963–2000,” Health Affairs 23, no. 4 (2004): 176–183.
13. D. Shactman et al, “The Outlook for Hospital Spending,” Health Affairs 22, no. 6 (2003): 12–26.
14. C. Lesser, P. Ginsburg, and L. Felland, “Initial Findings from HSC’s 2005 Site Visits: Stage Set for Growing Health Care Cost and Access Problems,” Issue Brief no. 97 (Washington: HSC, August 2005).
Bradley Strunk is a consulting health researcher at the Center for Studying Health System Change (HSC); he is located in Greenbelt, Maryland. Paul Ginsburg (pginsburg@hschange.org ) is president of HSC in Washington, D.C. Michelle Banker is a health research assistant at HSC.
A simulation of future spending finds that aging will not be the strongest influence on inpatient hospital use.
ABSTRACT:
This analysis examines how shifts in the age distribution of the U.S. population, reflecting both the aging of the baby-boom generation and increased longevity, will affect demand for hospital inpatient services during the next ten years. Over that period, aging will drive about 0.74 percent annual growth in use of services. Aging’s effect on inpatient demand varies by medical condition, with the highest rates of growth in services most used by elderly patients. Even for those services, however, aging is a much less important factor than local population trends and changing practice patterns attributable to advancing medical technology.
A common theme permeating a wide range of contemporary health policy debates is the gradual aging of the U.S. population and its effect on the U.S. health care system. As a result of the baby-boom generation—the leading edge of which is now turning age sixty—the proportion of the U.S. population older than age sixty-five is projected to grow from 12.4 percent in 2005 to 14.5 percent in 2015 and 18.2 percent in 2025.1 Although the aging of the baby-boom generation is a key factor in the aging of the population as a whole, increasing life expectancy is also important.
Numerous discussions regarding the U.S. hospital industry dwell on the need to expand capacity to accommodate a growing elderly population. With a sharp increase in hospital construction taking place and expansions often controversial, the aging of the baby boomers is often raised as a justification that cannot be disputed. But although few would dispute that aging will increase the demand for hospital services, previous research has suggested that in fact the magnitude might be small in relation to the overall trend.2
This study seeks to build on previous research on the effect of population aging on hospital use by examining how aging will specifically affect demand for inpatient services and how this impact will vary across medical conditions.
Study Data And Methods
This study predicts how changes in the age distribution of the U.S. population will affect the future use of hospital inpatient services, all else held constant. It seeks to isolate the effect of population aging (taking into account accepted assumptions about future fertility, mortality, and immigration) from other factors that could affect hospital demand. We devote most of our attention to a ten-year horizon, which is most relevant for hospital capacity planning. This exercise requires two distinct types of data: age-specific hospital inpatient utilization rates for a particular year, and age-specific projections of the U.S. population for each year during the projection period.
The study focuses specifically on inpatient hospital use. Although a study applicable to hospital outpatient settings would also be valuable, such a study would be limited by data availability and by the uncertainty of the outcome of the growing competitive battle between hospitals and physician-owned facilities, such as outpatient surgical centers, imaging centers, and physician offices, which provide increasingly more of the ambulatory tests and procedures received by U.S. patients.
The most recent surveys of outpatient hospitalization derive from the National Center for Health Statistics (NCHS) National Hospital Ambulatory Medical Care Survey (NHAMCS) and National Survey of Ambulatory Surgery (NSAS).3 Together, these surveys cover the spectrum of hospital services in ambulatory settings. However, the most precise measure of outpatient use is a count of outpatient visits. Because a count of visits does not distinguish between services requiring few resources, such as a visit for primary care, and those requiring extensive resources, such as complex imaging, it is not very useful for this analysis. Since the use of inpatient services varies more by age than use of hospital outpatient services does, limiting the study to inpatient services will result in a higher estimate of the impact of aging than one that covered all of hospital care.4
Inpatient use. We used two measures of total inpatient utilization, both derived from the 2003 Nationwide Inpatient Sample (NIS). Conducted by the Agency for Healthcare Research and Quality (AHRQ) as part of its Healthcare Cost and Utilization Project (HCUP), the NIS is a stratified probability sample of all nonfederal, short-stay, general, and specialty community hospitals in those states that contribute data to the HCUP. The thirty-seven states that contributed 2003 data to the project created a sample of 994 hospitals with 7,977,728 inpatient stays. The NIS is weighted to be representative of all U.S. inpatient stays.5
Since older hospitalized patients are likely to have higher resource needs (Exhibit 1), we used a more refined proxy for inpatient utilization than discharges: the all-payer severity-adjusted diagnosis-related group (APS-DRG) relative charge weights. DRGs form a system of classification that organizes inpatient hospitalizations into categories similar in diagnosis and treatment; APS-DRGs further divide DRGs into groups based on severity. Each APS-DRG corresponds to a specific charge weight that reflects its relative dollar amount of expenditures, controlling for variations in hospital-specific factors such as wages.
 APS-DRG relative charge weights were created by HSS Inc. using per person charge data from the 2001 NIS. Relative charge weights ranged from 0.096 to 26.212, with a mean charge of $14,738.60. A total expected expenditure on a given APS-DRG in 2003 is obtained by multiplying the relative charge weight associated with that APS-DRG by this mean charge value and 2003 NIS data on the number of charges for each APS-DRG. Cumulatively, these APS-DRG charge weights indicate detailed expenditures on the use of virtually all hospital inpatient services in 2003.6
The NIS sample is large enough to permit estimates of utilization by age and DRG, thereby allowing an examination of the varying effects of aging on inpatient hospital demand by medical condition. Using the 2003 NIS, we calculated age-specific utilization rates and simulated the impact of changes in the age distribution of the population for the full set of major diagnosis categories (MDCs)—groupings of DRGs—and for the ten most highly used DRGs specifically.7
Population estimates. The population estimates were developed by the U.S. Bureau of the Census Population Projection Program using the census 2000 modified race data. Time-series analysis of historical trends are used to extrapolate fertility, mortality, and immigration rates fifty years into the future.8 The impact of medical advances on the age distribution is captured by extrapolation of earlier trends in mortality.
Calculations. First, we calculated the per person utilization rate for people of each age up to eighty-five (all people age eighty-five and older are grouped together) using the 2003 NIS APS-DRG relative charge weights and total number of discharges and U.S. Census Bureau population projections for 2003. Second, for each age, we multiplied our calculated utilization rate estimate by the total number of people of that age in a given year as reflected in the Census Bureau population projections, giving a projection of total use for people of each age in that year. Third, we summed the projections of total use by age and divided by the total projected population, giving a simulated estimate of utilization per person for the entire population in that year. We repeated this procedure for each year in our study period, holding the utilization rates per person constant throughout, and we calculated the change from one year to the next. This change represents the effect of shifts in the age distribution of the population, holding all other drivers of hospital demand constant.9
We then compared this estimate to the Centers for Medicare and Medicaid Services’ (CMS’s) projected change in total inpatient hospital spending for the period 2005–2015. Although the CMS has not released projected data for inpatient revenue alone, we calculated past trend differences between inpatient and total hospital spending and assumed a continued differential.
Study Findings
Aging’s effect on total inpatient hospital utilization. The effect of aging on hospital utilization—or any other measure of utilization or spending, for that matter—will be driven by two factors: the rate at which the age distribution of the population is shifting toward older ages, and the rate at which utilization increases with age. Despite popular conceptions, the age distribution of the population shifts very slowly from one year to the next; between 2005 and 2015, the average age of the U.S. population is projected to increase from 36.5 to 37.9—an average annual increase of 0.37 percent. This slow growth in the age distribution of the population limits the magnitude of the impact on utilization.
Based on the methodology discussed above, our simulations indicate that from 2005 to 2015, per person inpatient resource use will increase by 7.6 percent because of aging, or 0.74 percent per year (Exhibit 2). When combined with projected population growth of 0.9 percent per year, total demographic trends will increase resource use by 1.6 percent per year. When a cruder measure of utilization is used—total discharges—the annual increase is 0.51 percent per year. Using APS-DRG weights has a meaningful impact on the results, increasing the estimate of aging by 45 percent.
 However, aging still accounts for a relatively small portion of the growth in hospital spending projected for the next decade: only 11.8 percent of the total increase in inpatient spending from 2005 to 2015.10
Many perceive that the impact of aging during the next ten years will be higher than it was for the previous ten years; this perception is correct. We estimate that aging increased inpatient utilization by 0.35 percent per year from 1995 to 2005. One can also assess the changing impact of aging by comparing annual increases in inpatient utilization for selected one-year periods. For 1994–95, 2004–05, and 2014–15, the aging factors are 0.33 percent, 0.63 percent, and 0.80 percent, respectively.
This increasing rate of growth in inpatient utilization because of aging results from the shape of the distribution of inpatient utilization by age (Exhibit 1). The distribution of charge weights indicates a greater increase in utilization among the elderly than the distribution of discharges; however, both graph lines reveal that utilization begins to accelerate when people reach their mid-50s and continues to rise until death. Consequently, as the baby-boom generation ages and the proportion of the population older than the mid-50s swells, inpatient utilization rates will accelerate accordingly.
Using the same methodology employed above, we projected annual per person changes in utilization through 2050. Aging will continue to increase utilization at an increasing rate until 2020–2022, when the yearly increase will plateau at 0.89 percent. By that point, the lagging edge of the baby-boom population will have passed the age at which age-specific utilization accelerates, so the yearly increase in inpatient utilization will become steadily smaller, declining to an increase of only 0.07 percent in 2050.
Variation by medical condition. The effect of aging varies widely across the types of medical conditions treated in an inpatient setting. Population aging will have a relatively large effect on the use of services by patients classified in the MDC “diseases and disorders of the circulatory system” (Exhibit 3).
 This MDC includes such highly used cardiovascular DRGs as 127 (heart failure and shock), 143 (chest pain), and 107 (coronary bypass with cardiac catheterization). Inpatient utilization for this group of DRGs will grow 11.8 percent per person, or 1.12 percent per person per year from 2005 to 2015, as a result of population aging alone. Aging will increase utilization for this MDC for 1994–95, 2004–05, and 2014–15 by 0.65 percent, 0.93 percent, and 1.23 percent, respectively (Exhibit 4).
 Population aging will also have a relatively large impact on a number of other categories of medical conditions, such as diseases and disorders of the male reproductive system (which includes the DRG for prostate cancer), diseases and disorders of the respiratory system (which includes the DRG for chronic obstructive pulmonary disease and pneumonia), and disorders of the musculoskeletal system and connective tissue (which includes a number of orthopedic-related DRGs, including hip replacement). Aging will drive 1.50 percent, 0.97 percent, and 0.84 percent per person annual growth in use for these MDCs, respectively.
Just as aging has a particularly large impact on selected sets of medical conditions, it also has the opposite effect on others. This is particularly true for DRGs related to maternity care and mental illnesses. In fact, population aging alone would actually lead to virtually no change or to a decline in annual per person use of three heavily used MDC groupings: pregnancy, childbirth, and the puerperium; newborns and other neonates with condition origin in the perinatal period; and mental diseases and disorders. From 2005 to 2015, if nothing other than the age distribution of the population changed, per person use of DRGs that fall under the two maternity care–related MDCs would change by –0.26 percent and –0.03 percent per year, respectively; during the same period, use of the DRGs for mental illness would decline by 0.12 percent per year.
Exhibit 5 presents the simulated effect of population aging on the ten most heavily used DRGs; it clearly demonstrates variation across medical conditions treated in the inpatient setting. For four of these ten DRGs—one cardiac-related condition, two respiratory-related conditions, and one orthopedic-related condition—aging’s impact on inpatient utilization will be greater than 1 percent per person per year during the next ten years. Meanwhile, population aging will have no effect on the use of four DRGs related to maternity care or mental illness.
 Discussion And Implications
A growing body of research in recent years has begun to quantify the effect of coming changes in the age distribution of the U.S. population that is largely attributable to the aging of the baby-boom generation. Although aging will likely have an important impact on spending, its magnitude will be dwarfed by the impact of advances in technology and other factors that affect medical practice patterns. To see this, consider coronary artery bypass graft (CABG) surgery and percutaneous transluminal coronary angioplasty (PTCA). Between 1993 and 2002, if nothing had changed other than the age distribution of the population, use of each of these procedures would have increased 0.6 percent per year. However, the actual rates of growth for these two procedures were strikingly divergent: The number of patients who received PTCA during an inpatient stay grew a total of 83.4 percent, or 7 percent per year, from 1993 to 2002, while the number of patients on which CABG was performed grew a total of 1.4 percent, or 0.2 percent per year.11
This study does not take into account potential interactions between changes in practice patterns and aging—in other words, will new technologies that increase use of services affect older people disproportionately? We do not see compelling evidence of any particular interaction. The empirical record of the past forty years does not exhibit a consistent pattern supporting the notion that the distribution of utilization by age is shifting toward older ages. Between 1963 and 1987, spending on hospital care per elderly American (8 percent per year) did in fact grow twice as fast as such spending on people under age sixty-five (3.8 percent per year). However, that pattern reversed itself between 1987 and 2000, when hospital spending among the population under age sixty-five outgrew such spending on elderly Americans by a three-to-one margin (3 percent versus 1 percent per year).12 Although having a large elderly population could influence priorities in industries that develop new medical technologies, this historical record suggests that advances in technology not responsive to health system developments will probably dwarf this incentive. Some have maintained that those in the baby-boom generation culturally are inclined to make greater demands on the medical care system than their parents and grandparents did, but we find it difficult to ever validate this, when baby boomers have dramatically expanded possibilities to draw from than did those a generation or two older.13
This analysis provides some guidance relevant to hospital industry planning for expansion of capacity. In general, the effect of aging effect on use of inpatient services will be small, but it will have a larger impact on use by patients with certain types of medical conditions that are more concentrated among the elderly. But for many of the conditions highlighted in this analysis, changing technology is a much larger factor in changes in treatment than population aging. In local geographic areas, forecasts of population growth will probably be more important for planning than forecasts of aging will be. Indeed, site-visit analyses in the Community Tracking Study (CTS) show sharp contrasts between areas like Phoenix, in which population growth is so high that risks of too much expansion of capacity are negligible, and areas like Syracuse, with stagnant or declining populations, which need to exercise much more care in forecasting demand.
Of course, hospitals must plan for capacity for ancillary services that will serve both inpatients and outpatients. But projecting demand for outpatient services is particularly difficult now because of recently developing trends of investment in outpatient facilities owned by physicians.14 These facilities’ competitive threat to hospitals could not have been foreseen a few years ago, which makes its importance five years into the future very difficult to predict.
The authors gratefully acknowledge the Robert Wood Johnson Foundation for its financial support.
NOTES
1. Calculated by authors from U.S. Census Bureau, “U.S. Interim Projections by Age, Sex, Race, and Hispanic Origin,” 26 August 2004, http://www.census.gov/ipc/www/usinterimproj (accessed 13 March 2006).
2. B.C. Strunk and P.B. Ginsburg, “Aging Plays Limited Role in Health Care Cost Trends,” Data Bulletin no. 23 (Washington: Center for Studying Health System Change, September 2002); U.E. Reinhardt, “Does the Aging of the Population Really Drive the Demand for Health Care?” Health Affairs 22, no. 6 (2003): 27–39; B. Alemayehu and K.E. Warner, “The Lifetime Distribution of Health Care Costs,” Health Services Research 39, no. 3 (2004): 627–642; and S.P. Keehan et al., “Age Estimates in the National Health Accounts,” Health Care Financing Review, 2 December 2004, http://www.cms.hhs.gov/apps/review/web_exclusives/keehan.pdf (accessed 14 March 2006).
3. For a complete description of the NHAMCS, see L.F. McCaif and T. McLemore, Plan and Operation of the National Hospital Ambulatory Medical Care Survey, Vital and Health Statistics Series 1, no. 34 (Hyattsville, Md.: National Center for Health Statistics, July 1994). For a complete description of the NHDS, see C. Dennison and R. Pokras, Design and Operation of the National Hospital Discharge Survey: 1988 Redesign, Vital and Health Statistics Series 1, no. 39 (Hyattsville, Md.: NCHS, December 2000).
4. We compared the age pattern of hospital visits for outpatient hospitalizations, emergency department (ED) services, and ambulatory surgery with that of inpatient discharges using the 1996 NHAMCS, 1996 NHDS, and 1996 NSAS. For a complete description of the NSAS, see T. McLemore and L. Lawrence, Plan and Operation of the National Survey of Ambulatory Surgery, Vital and Health Statistics Series 1, no. 37 (Hyattsville, Md.: NCHS, October 1997). All three surveys are conducted by the NCHS as components of its National Health Care Survey and therefore use the same hospital universe and a similar survey design. A simple comparison of outpatient and ED hospitalization, ambulatory surgery in a hospital setting, and inpatient hospitalization suggests that variation in use of outpatient and ED hospitalizations by age is much smaller than age variation in use of inpatient hospitalization. Outpatient and ED visits varied only by a factor of 2 between the lowest-using age group (children ages 6–12) and the highest-using age group (elderly adults over age eighty-five). In stark contrast, inpatient hospitalizations varied by more than a factor of 30 across age groups. The number of ambulatory surgery visits per person varied by a factor of 10 between the lowest-using group (children ages 6–12) and the highest-using group (adults ages 75–84).
5. For more information about the 2003 NIS, see Healthcare Cost and Utilization Project, “Overview of the National Inpatient Sample,” 6 January 2006, http://www.hcup-us.ahrq.gov/nisoverview.jsp (accessed 6 March 2006).
6. HSS Inc., All Payer Severity-Adjusted DRGs (APS-DRGs): Normalized Charge, LOS, and Mortality Weights Version 0402H (for APS-DRGs Version 21), 2004,
http://www.hcup-us.ahrq.gov/db/nation/nis/APS-DRGs%20V21%20Weights%20Manual.pdf (accessed 17 February 2006).
7. Our analysis at the MDC level excludes those DRGs that are assigned to multiple MDCs, with the exception of those that fall predominantly in one MDC. The DRGs excluded constitute only 0.75 percent of total discharges in 2003. Also, individual charge weight and discharge data for each age in Texas have been interpolated from data on five-year age intervals.
8. See U.S. Census Bureau, “U.S. Interim Projections”; see also U.S. Census Bureau, “Methodology and Assumptions for the Population Projections of the United States: 1999 to 2100,” Population Division Working Paper no. 38 (Washington: Census Bureau, January 2000), for detailed information about these assumptions.
9. This procedure replicates that of previous analyses; for example, see Strunk and Ginsburg, “Aging Plays Limited Role”; and Reinhardt, “Does the Aging of the Population?”
10. The Centers for Medicare and Medicaid Services provide projections for total hospital spending through 2014 based on data from the 2003 National Health Expenditure Accounts. We extended the projection to 2015 by assuming the same annual increase as projected for the 2010–2014 period. We used past trend differences between inpatient and total hospital spending to predict inpatient revenue from 2005 to 2015.
11. Authors’ calculations based on data from the NIS. Data obtained through AHRQ, HCUPNet, http://hcup.ahrq.gov/HCUPnet.asp (accessed 6 March 2006).
12. E. Meara, C. White, and D.M. Cutler, “Trends in Medical Spending by Age, 1963–2000,” Health Affairs 23, no. 4 (2004): 176–183.
13. D. Shactman et al, “The Outlook for Hospital Spending,” Health Affairs 22, no. 6 (2003): 12–26.
14. C. Lesser, P. Ginsburg, and L. Felland, “Initial Findings from HSC’s 2005 Site Visits: Stage Set for Growing Health Care Cost and Access Problems,” Issue Brief no. 97 (Washington: HSC, August 2005).
Bradley Strunk is a consulting health researcher at the Center for Studying Health System Change (HSC); he is located in Greenbelt, Maryland. Paul Ginsburg (pginsburg@hschange.org ) is president of HSC in Washington, D.C. Michelle Banker is a health research assistant at HSC.
by Bradley C. Strunk, Paul B. Ginsburg, and Michelle I. Banker
Health Affairs 25, published online 28 March 2006


<< Home